MEASURING AND MODELLING POPULATION CHANGE
- Carrying capacity is the maximum number of organisms an ecosystem can sustain
- As populations increase the amount of available resources decreases. Factors That Affect Population Growth
- Population dynamics are changes in population characteristics (such as natality, mortality, immigration and emigration)
- Fecundity is the potential number of offspring a species can produce in one lifetime (usually limited by the females)
- There are three types of survivorship curves:
Ex. Slow to reach sexual maturity and have a small number of offspring.
o Type III has a high mortality rate when young and individuals that reach reproductive years have a reduced mortality.
Ex. Low average life expectancy and produce large number of offspring (green sea turtle)
o Type II has a uniform risk of mortality throughout their life.
Fertility (offsping that are actually produced in a lifetime) is often less than fecundity. Food availability, mating success and disease limits reproductive potential.
Calculating Changes in Population Size
Popn. change = [(births + immigration)–(deaths +emigration)]X 100
Initial popn. Size (n)
- In an open population, changes are influenced by natality, mortality, and migration
- Closed populations are influenced by natality and mortality only.
- The biotic potential (r) is the maximum reproductive rate under ideal conditions.
Population Growth models
- Exponential Growth: occurs when a population grows continuously at a constant rate (no fixed breeding season)
dN = rN where r is the per capita birth rate
dt and N is the popn. Size
popn. doubling time: td = 0.69
r
The result is a smooth J-shaped curve
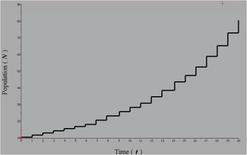
- Geometric growth: when birth rates and death rates remain constant, populations grow at a fixed rate in a fixed time interval
- For species that are restricted to a particular breeding season, they exhibit geometric growth
- For geometric growth, organisms reproduce at fixed intervals (like years) at a constant rate
N(t) N(2) = N(0)LxL
N(3) = N(0)LxLxL
N(t) = N(0)L^t
The result is a graph with stepwise increments
Modelling Logistic Growth
dt N is popn. size and
K is the carrying capacity
Logistic Growth Curve
Assessment
- population growth that levels off as the popn. size reaches the carrying capacity
dt N is popn. size and
K is the carrying capacity
Logistic Growth Curve
- results in a S-shaped curve.
- The lag phase occurs when the population is small and slowly increasing.
- The log phase occurs when the population is growing rapidly.
- The population experiences environmental resistance; where the available resources limit the biotic potential.
- The stationary phase occurs at or near carrying capacity.
- The population is said to be at dynamic equilibrium, since the number of births equals the
number of deaths.
Assessment
| interpreting_population_graphs.docx |
| lesson_of_the_kaibab.docx |
